Roll Shaper
Clinical Research
Table of contents
1. Introduction
The clinical research was carried out in NZOZ MAXMED 1 in European Union, from August 2008 to July 2009. The aim of the research was to determine the effect of the Roll Shaper® device on the organism. Before the start of the study, the patient consented to participate in the study and completed a patient study card. In this card, the subject specified general well-being, addictions, allergies, listed diseases of the cardiovascular system, gastrointestinal tract, genitourinary tract, nervous system, oncology, skin, endocrine disorders and other ailments. The scope of the study consisted of 5 measurements (before the study, after 5, 10, 15 and 20 treatments). On each occasion, weight, blood pressure, circumferences of the right and left arm, right and left forearm, waist, hips, right and left thigh and right and left lower leg were measured. BMI was also determined based on body weight and height. Functional tests (toe distance test, Laseque test and abdominal muscle strength test) were also performed (Buckup 2007). Treatments took place daily or every two to three days. Of those who received daily treatments, 10 people were applied 2 treatments per day to determine whether more treatments caused negative consequences.
As mentioned, the study took place on a Roll Shaper® device. During the treatment, the subject assumed 18 positions according to the instructions. These positions guaranteed lymph flow according to the indications for lymphatic massage. The lymph flow was essentially facilitated by suitably profiled balusters with a width of 58cm.The positioning of the balusters imitates the grips for lymphatic massage. One of the reasons for this is that the waist in every second baluster is shifted by half compared to the previous one. This positioning of the balusters allows fluids to move towards the lymph nodes. In order to intensify the massage, the work of the device can also be assisted by the movement of the corresponding body parts across the balusters, which, however, is not necessary.
2. Characteristics of the test subjects.
Measurements of the above-mentioned parameters took place 5 times. A total of 100 people took part in the study. The measurement after 5 treatments was taken by 97 subjects (97% of the subjects), the measurement after 10 treatments was taken by 95 subjects (95% of the subjects). The measurement after 15 treatments was taken by 91 people (91% of the subjects), while the last measurement was taken by 77 people (77% of the subjects). Of the 23 subjects who discontinued treatments, in three cases this concerned an exacerbation of previously reported complaints or due to poor tolerance of the treatment. In a further five cases, the subjects discontinued the treatments due to illness unrelated to the treatments or for professional reasons. 15 subjects discontinued the treatments without giving a reason.
2.1. Gender and age.
The vast majority of the study subjects who underwent the 20 treatments were women – 74 subjects (96.1% of the study subjects). Men, three persons, accounted for 3.9% of the study population (fig. 1). The age structure of the study population was as follows: 1.3% of the subjects were under 20 years of age. Subjects between 21 and 29 years of age accounted for 23.38% of the study population. Persons between 30 and 39 years of age represented 22.08% of the study population. Those aged 40 – 49 accounted for 24.67% of the study population. The largest group – 25.97% of the sample – was between 50 and 59 years of age. Persons aged 60 and over accounted for 2.6% of the study population (Fig. 2).
Gender breakdown
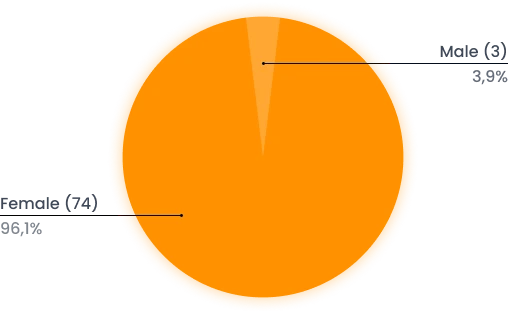
Figure 1: Gender breakdown of the study group.
Age breakdown
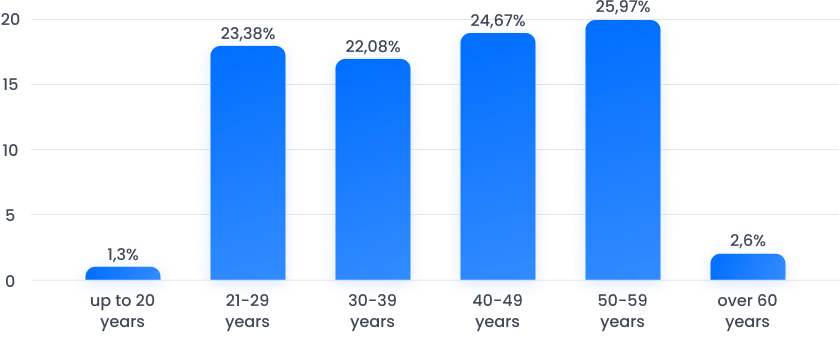
Figure 2: Breakdown of the study group by age.
2.2 Body weight and BMI before the start of the treatments.
The study population’s body weight and height before the start of the treatments were determined. The average body weight of the study population before the start of the treatments was 74.68kg. 9 people (11.69%) of the subjects weighed less than 60kg. 28 people (36.36%) were between 60kg and 69.99kg. 18 people (23.38%) were between 70kg – 79.99kg. 8 people (10.39%) were in the 80kg – 89.99kg range. The least, 5 people (6.49%) were in the 90kg – 100kg range, while 9 people (11.69%) weighed more than 100kg (Fig. 3).
Body weight breakdown before treatments

Figure 3: Body weights of the study population before the treatments.
A baseline BMI (body mass index) was also calculated for the study population to determine the degree of obesity prior to the start of the treatments. The mean BMI level before the start of the treatments was 27.98. This mean indicates that the study population is overweight. None of the subjects were underweight. Twenty-six people (33.77%) were between 18.5 and 24.9, so their weight was normal. The largest number of subjects, 31 (40.26%), were overweight, as they fell into the range 25 – 29.99. 13 subjects (16.88%) fell into the range 30 – 34.99, which means grade I obesity. Three subjects (3.9%) fell within the range 35 – 39.99. This result represents degree II obesity. Level III obesity, i.e. a score above 40, was obtained by 4 subjects (5.19%). A total of 20 subjects (25.97%) were characterised by obesity (Fig. 4).
BMI breakdown before treatments

Figure 4: BMI of the study population before the start of the treatments.
2.3 Flexibility and abdominal mm strength of the subjects before the start of the treatments.
Of the 77 subjects who completed the study, 5 subjects did not perform the supine sit-up (abdominal mm test) correctly.
To assess the subjects’ flexibility, a toe-to-floor distance test was performed. Of the 77 subjects, 54 performed this test correctly, i.e. they touched the ground with their toes while bending forward with their knees straight. 23 did not perform this test correctly. The result of the distance of the toes from the ground from 1cm to 5 cm was obtained by 4 subjects, 5cm – 10 cm was obtained by 9 subjects, while the result of more than 10 cm was obtained by 10 subjects (Fig. 5).
In addition, a modified Laseque test was used to assess flexibility for both lower limbs. Range of movement was measured to the nearest 5⁰. Of the 77 subjects, 37 had full range of motion (leg raised 90⁰ to the ground). In contrast, 40 people had restricted movement in at least one limb. A range of limb movement of 80⁰- 85⁰ was present in 17 people for the left lower limb and in 16 people for the lower limb right. A range of 60⁰ – 75⁰ was achieved by 17 people for the left lower limb and 19 persons for the right lower limb. The lowest result 40⁰ – 55⁰ was achieved by 5 subjects for the left lower limb and 4 subjects for the lower limb right (Fig. 6).
Toe-to-floor distance breakdown before treatments
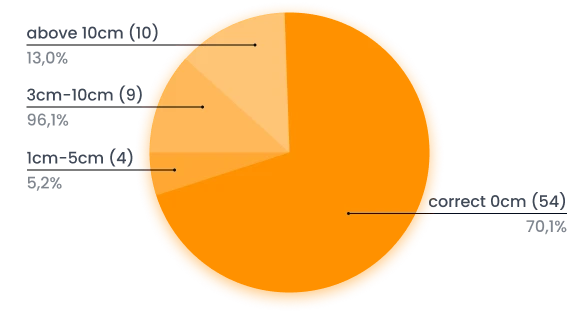
Figure 5. Subjects’ performance of the toe-to-floor distance test before the treatments.
Modified Laseque test for both lower limbs before treatments
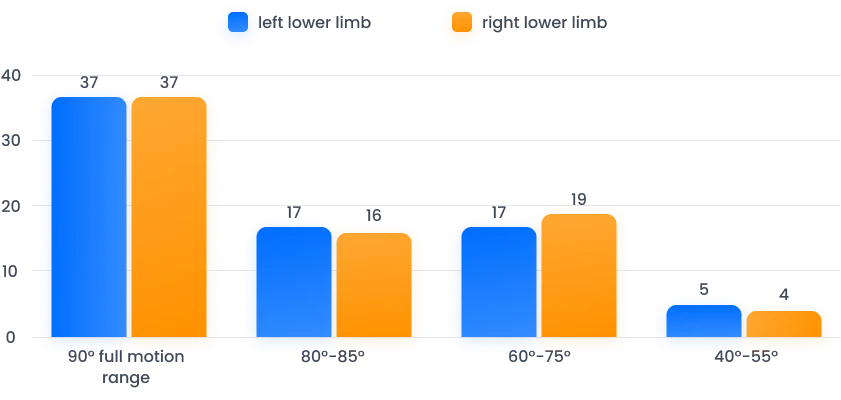
Figure 6. Modified Laseque test for both lower limbs before treatments.
2.4 Health status of the subjects before the treatments.
The vast majority of subjects described their well-being as very good or good (96 subjects). 2 people described their well-being as a medium, while 2 could not specify their level of well-being. 14 people admitted to having addictions. Smoking was declared by 12 people, while a weakness for sweets was declared by 2 people. A variety of complaints were reported by people who came to the survey. 9 people complained of allergies. The most common complaints were: hay fever, allergies to dander, dust, medication, food, etc.
As many as 22 people complained of cardiovascular diseases. The most common condition was hypertension, from which 13 people suffered. 5 people reported that they suffered from varicose veins in the lower limbs. Other cardiovascular conditions mentioned in the questionnaires included post-infarction conditions, coronary artery disease, and lymphatic disorders.
9 people reported complaints of the digestive system. The most frequently mentioned conditions were reflux (3 cases), irritable bowel syndrome (2 cases), and frequent inflammation (2 cases). 4 people reported urogenital complaints (incontinence, lithiasis and others). 10 people complained of endocrine disorders. The most common was hypothyroidism (3 cases).
4 people also complained of depressive conditions, and 4 people reported rheumatic complaints. 8 respondents mentioned arthritis, including the spine, among their complaints, and 2 complained of headaches. Other conditions reported included psoriasis, eczema, condition after excision of a lump on the breast, and schizophrenia.
3. Research findings.
3.1. Change in body weight.
Throughout the study period, body weight was calculated five times. It will be recalled that before treatment, the average body weight for the entire population was 74.68kg. After five treatments, this result dropped to 74.48kg. After ten treatments, the body weight was 74.34kg. After 15 treatments, the subjects’ body weight dropped to 74.16kg, only to drop slightly further to 74.12kg after 20 treatments. However, the downward trend continued throughout the study, which can be seen in Fig. 7.
In addition, statistical calculations were performed to determine whether the changes in body weight under the treatments were statistically significant. The results of the calculations are presented in Table 1.
Change in mean body weight of the study population
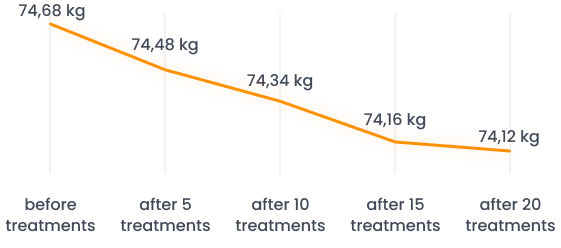
Figure 7. Change in mean body weight of the study population.
| DIFFERENCE | df | F | significance |
|---|---|---|---|
| Measurement after 10 – before treatments | 1 | 10,461 | 0,02 |
| Measurement after 20 – before treatments | 1 | 16,461 | 0,01 |
Tab. 1 Statistical analysis of the change in body weight of the study population under the influence of the treatments.
As can be seen from the table above, the change in body weight under the influence of the treatments is statistically significant.
3.2 Blood pressure.
The participants’ blood pressure was also measured. These measurements, like others, were taken before the series of procedures and after 5, 10, 15, and 20 procedures. Analysis of the obtained values indicates that the blood pressure of the participants during the series of procedures and after its completion remains unchanged, stabilizing at a specific level. No significant deviations in the measurements were observed, leading to any conclusions about the impact of the procedures on blood pressure.
3.3 Change in circumferences
Along with the change in body weight, a change in the circumferences of the measured body parts was also observed. The mean value of the circumferences of the right arm decreased from 31.09cm to 29cm, while the mean value of the circumferences of the left arm decreased from 30.73cm to 28.81cm. The change is shown in Fig. 8.
The mean value of forearm circumferences decreased, for the right forearm from 25.35cm to 24.34cm, while for the left forearm from 24.85cm to 24.03cm. The results are shown in Fig. 9
Change in arm circumferences under the treatments

Figure. 8 Change in arm circumferences under the treatments.
Change in forearm circumferences under the treatments
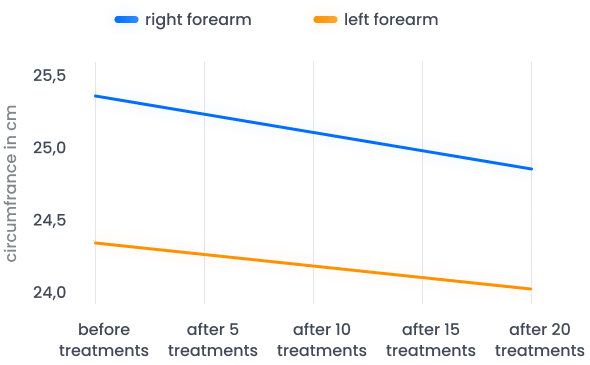
Figure 9: Change in forearm circumferences under the treatments.
A decrease in circumference was also observed for waist circumference and hip line circumference. In the first case, the decrease was 4.54cm, from 88.83cm to 84.29cm. The hip line circumference decreased by 2.9cm. on average, from 106.71cm to 103.81cm. These changes can be seen in Fig. 10.
Circumference changes were also observed in the lower limbs. The circumference of the thighs decreased on average: for the right thigh by 2.42cm, from 58.45cm to 56.03cm. For the left thigh, the circumference decreased by an average of 2.34cm, from 58.6cm to 56.26cm. This change is shown in Fig. 11.
Change in waist and hip line circumferences under the treatments
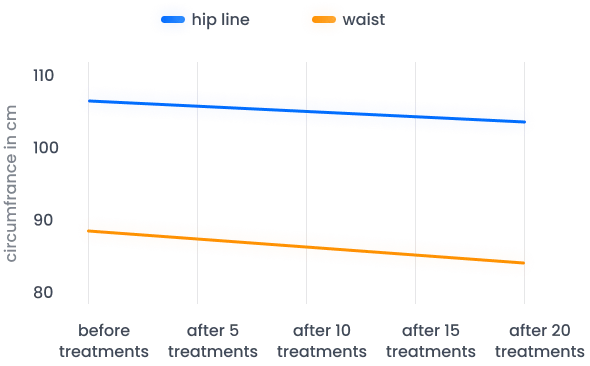
Figure 10. Change in waist and hip line circumferences under the treatments.
Change in thigh circumferences under the treatments

Figure 11. Change in thigh circumferences under the treatments.
The circumferences of the lower legs also changed. The right shins decreased by an average of 1.08cm, from 38.35cm to 37.27cm. The left shins decreased by an average of 1.32cm, from 38.64cm to 37.32cm. These changes can be seen in Fig. 12.
As in the case of body weight, a statistical analysis was also carried out for circumferences statistical analysis to determine the statistical significance of the change in particular circumferences. The results of the statistical significance analysis of the change in the circumferences studied are presented in Table 2.
As can be seen from the table above, the changes in all the circumferences studied are statistically significant.
Change in lower leg circumferences under the treatments
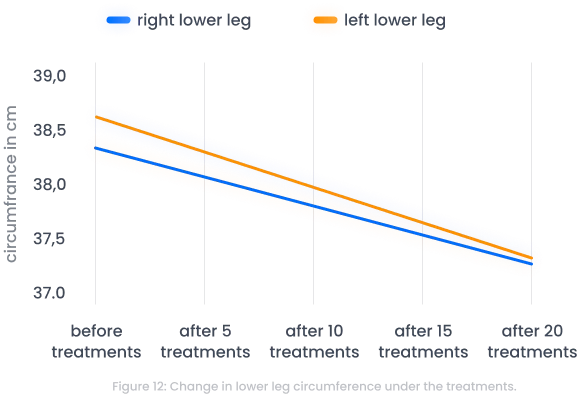
Figure 12: Change in lower leg circumference under the treatments.
| Circumference measurement | DIFFERENCE | df | significance |
|---|---|---|---|
| Arm right | after 20 treatments – before treatments | 1 | < 0,01 |
| Arm left | after 20 treatments – before treatments | 1 | < 0,01 |
| Forearm right | after 20 treatments – before treatments | 1 | < 0,01 |
| Forearm left | after 20 treatments – before treatments | 1 | < 0,01 |
| Waist | after 20 treatments – before treatments | 1 | < 0,01 |
| Hip line | after 20 treatments – before treatments | 1 | < 0,01 |
| Thigh right | after 20 treatments – before treatments | 1 | < 0,01 |
| Thigh left | after 20 treatments – before treatments | 1 | < 0,01 |
| Lower leg right | after 20 treatments – before treatments | 1 | < 0,01 |
| Lower leg left | after 20 treatments – before treatments | 1 | < 0,01 |
Tab. 1 Statistical analysis of the change in body weight of the study population under the influence of the treatments.
3.4. Change in the results of the flexibility and abdominal muscle strength tests.
As mentioned earlier, 5 subjects out of 77 did not perform correctly on the abdominal muscle strength test. 3 of them (60%) performed this test correctly after only 5 treatments, while 2 did not perform this test correctly even after 20 treatments. As already mentioned, 23 people did not perform this test correctly before the treatments. The result of the distance of the toes from the floor from 1cm to 5cm was obtained by 4 subjects, 5cm – 10cm was obtained by 9 subjects, while the result above 10cm was obtained by 10 subjects. After 20 treatments, the number of subjects who failed this test was 15, with 4 subjects scoring 1cm – 5cm, 8 subjects scoring 5cm – 10cm, and only 3 subjects scoring above 10cm. (Fig. 13).
Charge in toe-to-floor distance after 20 treatments

Figure 13: Change in toe-to-floor distance test after 20 treatments.
40 of the 77 subjects (52%) had mobility limitations measured by the modified Laseque test in at least one limb at the start of the study. After a series of 20 treatments, the number of subjects with a normal test result (90⁰) increased from 38 to 62 for the left leg and from 38 to 60 for the right leg. There was also no person with a score below 60⁰ after 20 treatments (Fig. 14).
Charge in toe-to-floor distance after 20 treatments
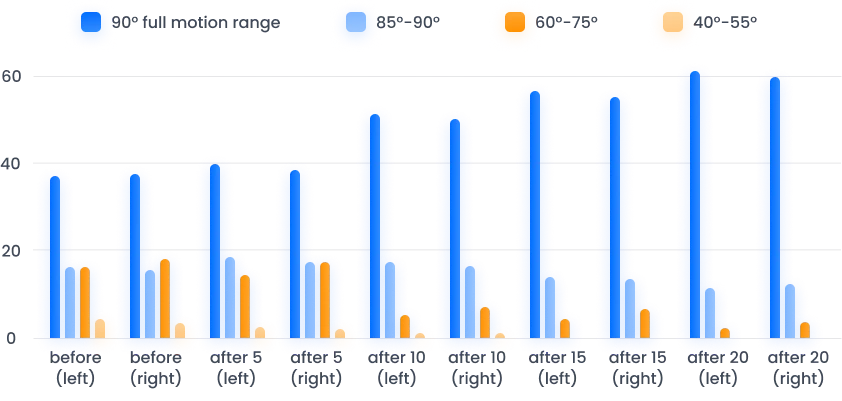
Figure 13: Change in toe-to-floor distance test after 20 treatments.
3.5. Reported complaints during the treatments.
During the course of the study, 23 subjects discontinued treatments before completing the treatment series. As many as 18 subjects discontinued treatments for reasons unrelated to illness or pain complaints (lack of time, work, not reported). 2 people discontinued treatments due to illness unrelated to the use of massage. One person discontinued the study already after the second treatment due to increasing pain in the limbs (related to varicose veins and other ailments). One person, in the meanwhile, bruised the ribs and discontinued the treatments after 17 massages due to pain. One man discontinued the study after the 16th massage as a result of increasing stomach complaints (the respondent had previously reported reflux). As mentioned, 10 subjects received treatments daily with double the number of treatments. Subjects who did not complain of more serious complaints were selected for this experiment. These people, especially during the first treatments, reported pain of muscular origin, similar to symptoms of overtraining. However, after a period of adaptation, they showed boredom with excessive time strain.
4. Conclusions.
– After a series of 20 treatments, mean body weight and BMI levels decreased in the group of subjects who underwent massages on the Roll Shaper device.
– A decrease was observed in the mean score of all tested circumferences: arms, forearms, waist, waistline, hip line, thighs and lower legs in subjects who underwent a series of 20 treatments on the Roll Shaper device.
– An increase in flexibility, as measured by the toe-off test and the modified Laseque test, was observed after a series of 20 treatments in the study group.
– The shape of the device and the profile of the balusters are suitable to achieve the desired effects.
– Roll Shaper massage can be used as an adjunctive treatment in the fight against obesity.
– Based on the study, it is not possible to create a list of contraindications for the use of Roll Shaper massage treatments.
– It is not recommended to perform treatments more than once a day, especially in people with cardiovascular complaints.
Literature
K. Buckup (2007). Clinical tests in the examination of bones, joints and muscles. Warsaw: PZWL
Bartosz Chmielewski
MA in physiotherapy
